Is electric field in our house a fiction?(February-2014)
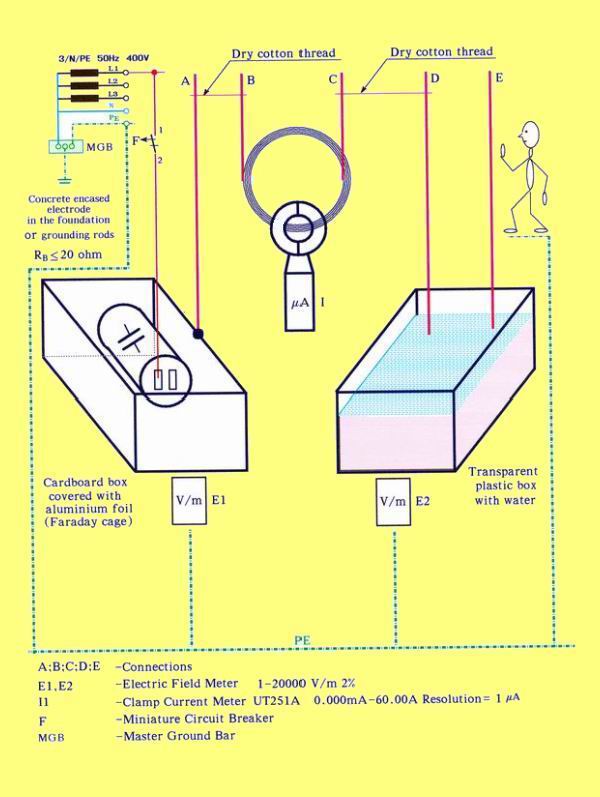
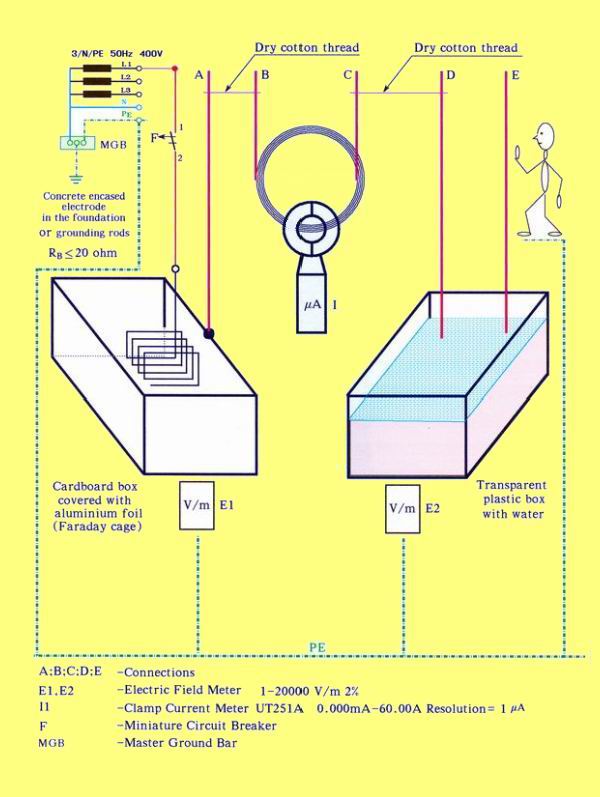
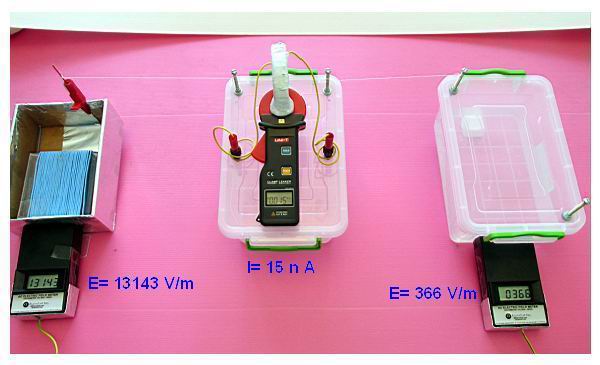
Maybe yes. But if is true, what we are measuring in reality with the device "AC electric field meter "? Answers to these questions are the issue of this paper. In order to answer these questions and receive an updated explanation regarding the phenomenon, I have made several special experiments with measurements. The experiments are described as follows, and the terms used are: “A thin cotton thread and electric field”,“Current adapter”,“1/X or 1/X2”, "Proportionality", and "Leakage current outside". A thin cotton thread and electric field A thin cotton thread is connected between a source of electric field and a box from plastic filled with water. The thread is cut in the middle and connected in series with a current adapter for measuring nano amps. Yes, nanoamps (10-9-billionsh). Figs. 1, 2 and 3 show the schematic diagram when the source of electric field is a capacitance 20 Micro F connected to the local utility only by the phase L (hot in USA). The second pole of capacitance is insulated.
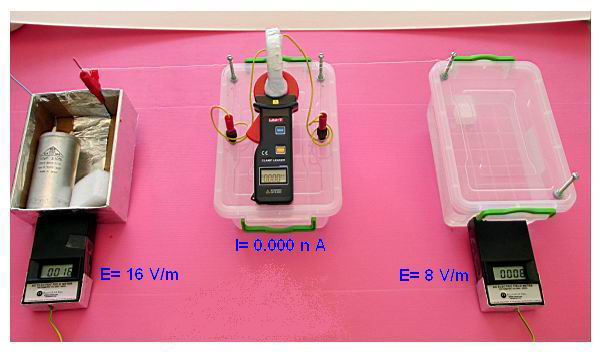
Fig. 1. Electric field strength and leakage current measurements. F=OFF
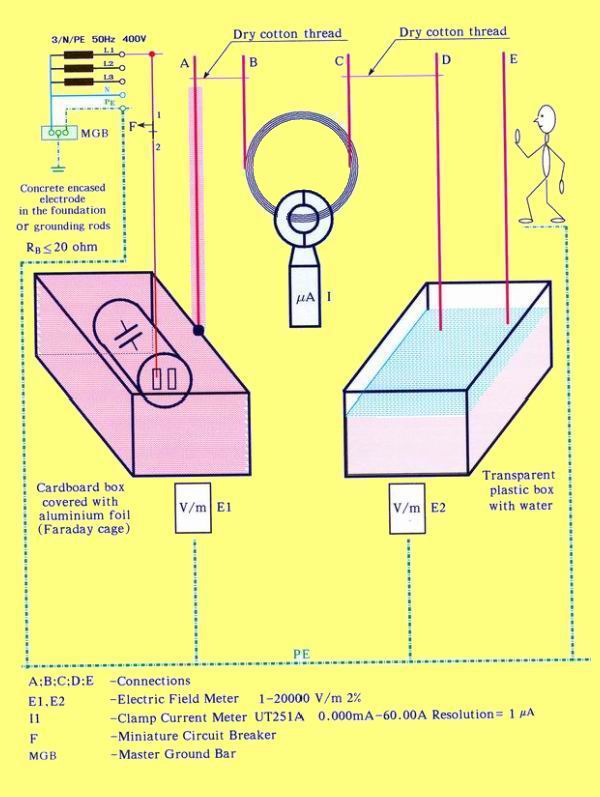
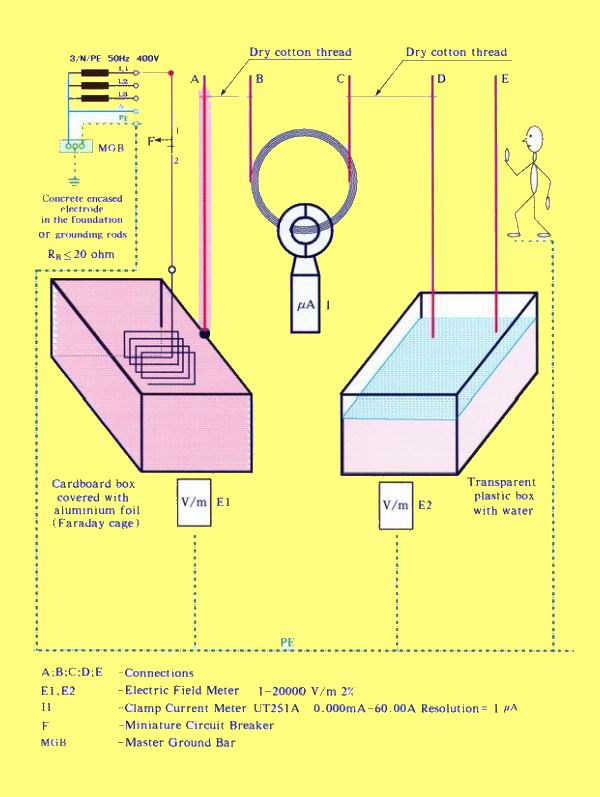
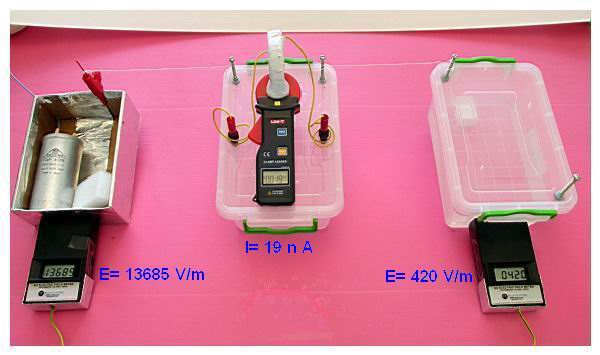
Fig. 2. Electric field strength and leakage current measurements F=On; L=230V; Dry thread.
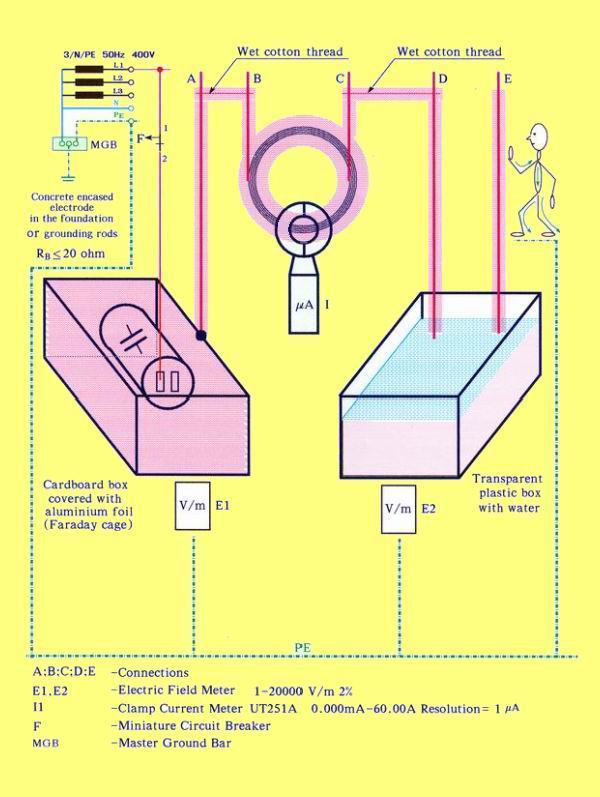
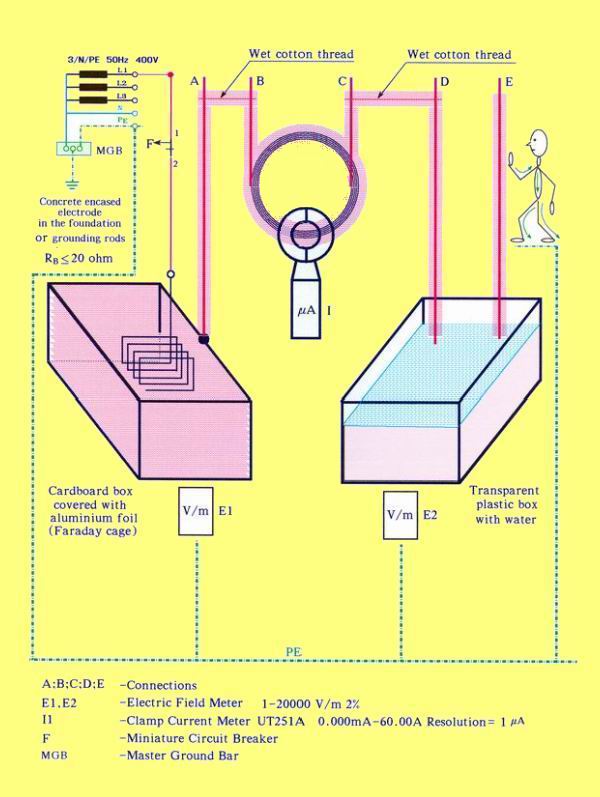
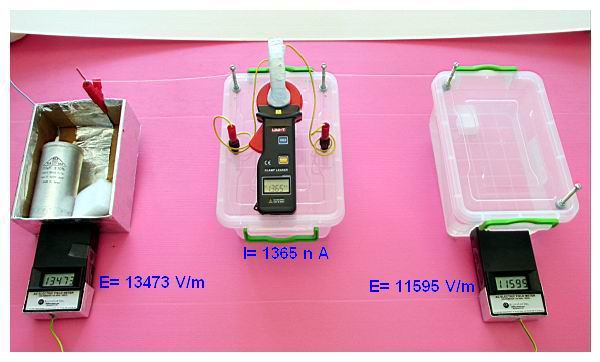
Fig. 3. Electric field strength and leakage current measurements. F=On; L=230V; Wet thread.
Figs. 4, 5 and 6 is similar to the previous one, except the source of electric field that is an air coil (PVC copper conductor 10m; 0.5mm2). The second pole of air coil is insulated.
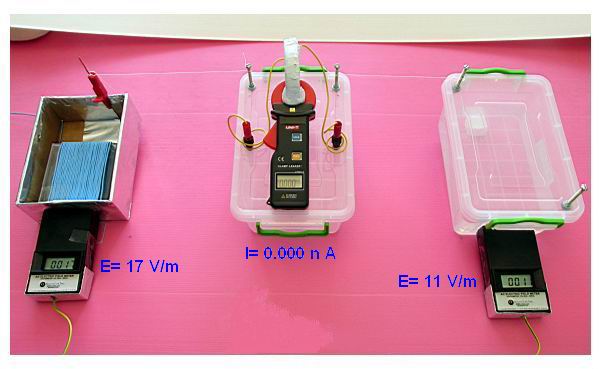
Fig. 4. Electric field strength and leakage current measurements F=OFF
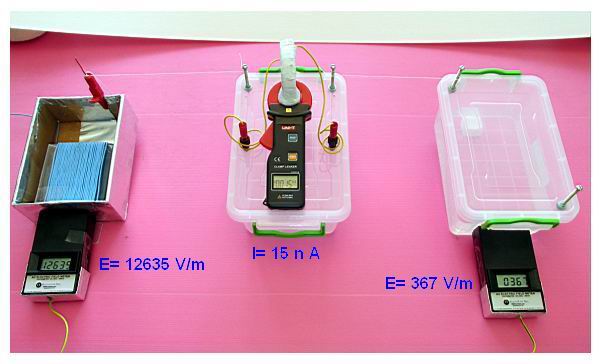
Fig. 5. Electric field strength and leakage current measurements F=On; L=230V; Dry thread.
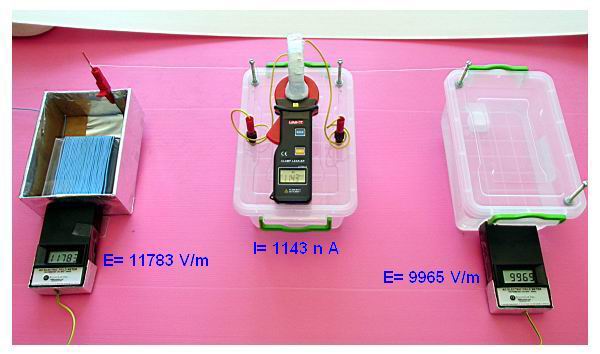
Fig. 6. Electric field strength and leakage current measurements F=On; L=230V; Wet thread.
Figs. 7 to 11 show the measurements of electric field strength and leakage current when a source of electric field is a capacitance 20 Micro F. Figs. 12 to 16 show the measurements of electric field strength and leakage current when a source of electric field is an air coil. The experiments include 5 states:
F=Off
F=ON; L=230V; Dry thread.
F=ON; L=230V; Wet thread.
F=ON; L=230V; Wet thread; Box with water connected to ground.
After 30 minutes. F=ON; L=230V; Dry thread.
Fig. 7. Electric field strength and leakage current measurements F=Off.
Fig. 8. Electric field strength and leakage current measurements F=On; L=230V; Dry thread.
Fig. 9. Electric field strength and leakage current measurements F=On; L=230V; Wet thread.
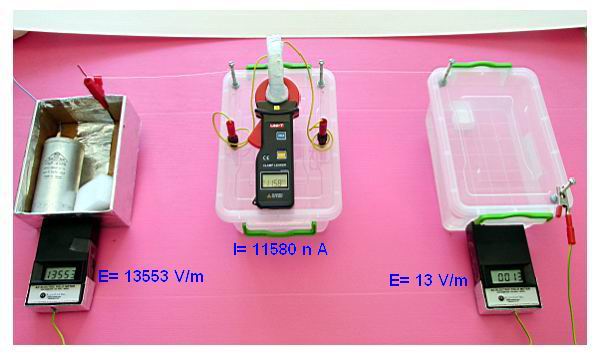
Fig.10. Electric field strength and leakage current measurements F=On; L=230V; Wet thread. Box with water connected to ground
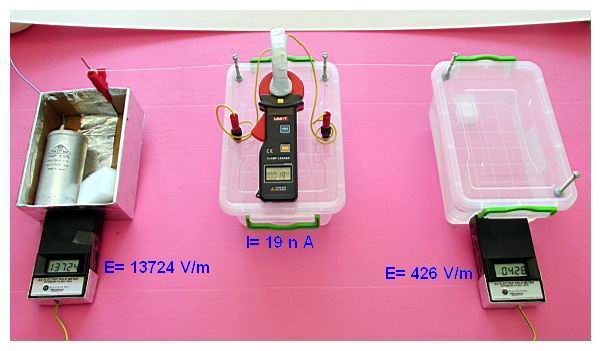
Fig.11. Electric field strength and leakage current measurements After 30 minutes; F=On; L=230V; Dry thread.
Fig.12. Electric field strength and leakage current measurements F=Off.
Fig.13. Electric field strength and leakage current measurements F=On; L=230V; Dry thread.
Fig.14. Electric field strength and leakage current measurements F=On; L=230V; Wet thread.
Fig.15. Electric field strength and leakage current measurements F=On; L=230V; Wet thread. Box with water connected to ground
Fig.16. Electric field strength and leakage current measurements After 30 minutes; F=On; L=230V; Dry thread.
The electric field strength and the leakage current measurements that appear in Figs. 7 to 16 are shown in Tables I and II.
Source C= 20 Micro F
Electric Field E1
Leakage Current I
Electric Field E2
V/m
Nano (10-9) amps
V/m
F=Off
16
0.000
8
F=On; Dry thread
13685
19
420
F=On; Wet thread
13473
1365
11595
F=On; Wet thread; Box with water connected to ground
13533
11580
13
F=On; After 30 minutes
13724
19
426
Table I Electric field strength and leakage current measurements. Source of electric field is a capacitance 20 Micro F
Source Air coil; 10m; 0.5 mm2
Electric Field E1
Leakage Current I
Electric Field E2
V/m
Nano (10-9) amps
V/m
F=Off
16
0.000
8
F=On; Dry thread
12635
15
367
F=On; Wet thread
11783
1143
9965
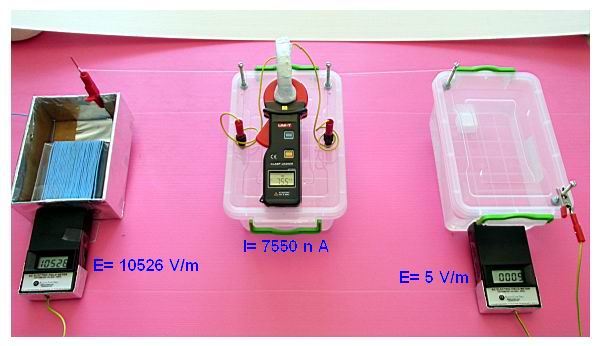
F=On; Wet thread; Box with water connected to ground
10526
7550
5
F=On; After 30 minutes
12143
15
366
Table II Electric field strength and leakage current measurements. Source of electric field is an air coil
The values in tables I and II highlight some important facts:
For source capacitance C= 20 Micro F. It is enough 1365 nanoamps (1.365 microamps) through wet thread and the box of plastic filed with water becomes by itself source of leakage current.
For source air coil. It is enough 1143 nanoamps (1.143 microamps) through wet thread and the box of plastic filed with water becomes by itself source of leakage current.
When the box with water is connected to ground leakage current increases (11580 nanoamps for C = 20 micro F and 7550 nanoamps for air coil) and the electric field strength outside the box decreases to a minimum.The same phenomenon occurs in all domestic appliances connected to local source via three wire cord (L; N; PE) such as washing machine, refrigerator, oven, computer etc. The conductor (PE) download leakage current to ground and the electric field strength is minimal. In old apartments where the connection to the ground is faulted and lacks local electrode, all domestic appliances connected to local source via three wire cord (L; N; PE) become by themselves sources of leakage currents.
In the vegetal world (trees, shrubs, flowers layers) millions of microscopic layers (Cambium and Xylem) download leakage currents to earth. The cambium is a very thin layer of tissue, sometimes only one cell thick. The xylem carries water and other nutrients up to the leaves. This explains why trees reduce the electric field strength outside.
Current adapter It is simple, it is cheap and is enable to measure nano amps leakage currents in our house and outside. Table III shows technical data.
Current adapter for measurements Nano amps
Technical data
Shape
Round
Wire materiel
Insulated copper
Wire diameter
0.3-:- 0.4 mm
Windings
1000
Inside diameter
60-:- 80 mm
Table III Current adapter. Technical data
With insulated copper wires with diameters between 0.2 -:- 0.08mm it is possible to make current adapters with 10,000 windings and even 100,000 windings. We will be able to measure 0.1 and 0.01 nanoamps. It remains the problem of accuracy due to increased ohmic resistance of the adapter. Proportionality There is proportionality between the measured values of electric field strength and measured values of leakage current? In other words, to measure the electric field strength is enough to appreciate the value of leakage current? Answer to this question is by looking at the values in Table IV based on measurements from Figures 17 to 19.
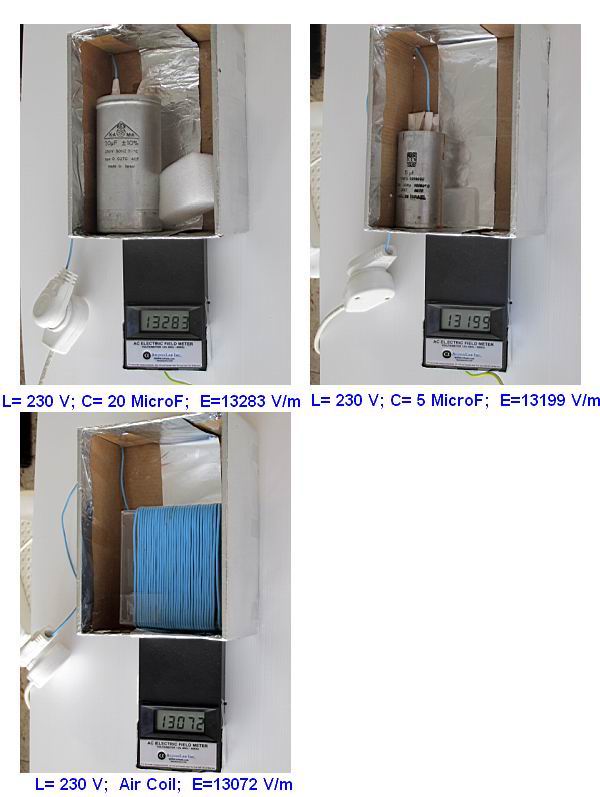
Fig. 17. Electric field strength measurements-for different sources
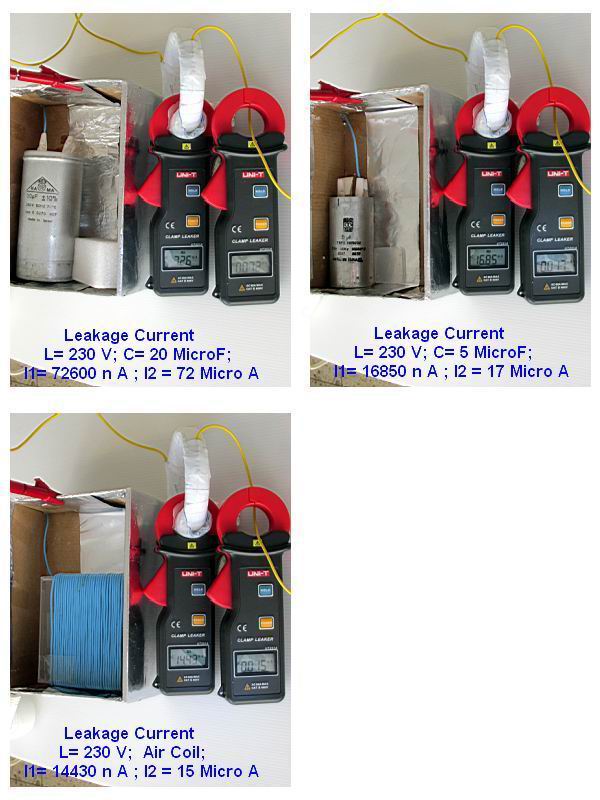
Fig. 18. Leakage currents measurements-for different sources
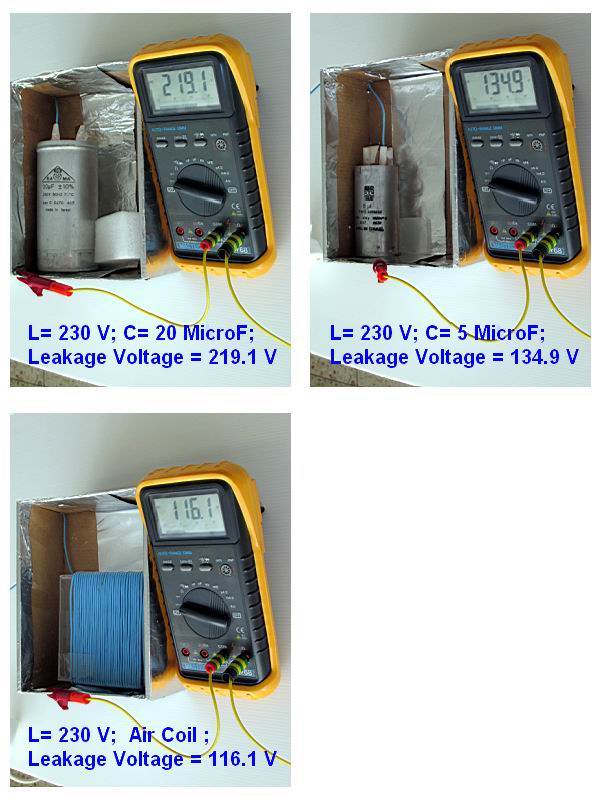
Fig. 19. Leakage voltage measurements-for different sources
Source Leakage current
Electric Field
Leakage Current
Leakage Voltage
E
I1
I2
Accuracy
V
V/m
n A
Micro A
%
Volt
C= 20 Micro F
13283
72600
72
+0.83
219.1
C= 5 Micro F
13199
16850
17
-0.88
134.9
Air coil 10m; 0.5 mm2
13072
14430
15
-3.8
116.1
Proportionality
13283-13072=211 211/13072x100= 1.61%
72-15=57 57/15x100= 380%
219.1-116.1=103 103/116.1x100= 88.7%
Table IV Electric field strength, leakage current and leakage voltage measurements. Sources: C20 Micro F; C5 Micro F; Air coil
Unequivocal, for electric field strength between 13072 to13283 V/m there is not proportionalitybetween themeasured valuesofelectric field strength andmeasured valuesofleakage current.
1/X or 1/X2 By what kind of law is spreading in our house electric field strength, leakage currents and leakage voltage. In order to achieve the correct answer I used two experimental stands. The stands are described as follows, and the terms used are: "Stand 1" and "Stand 2".
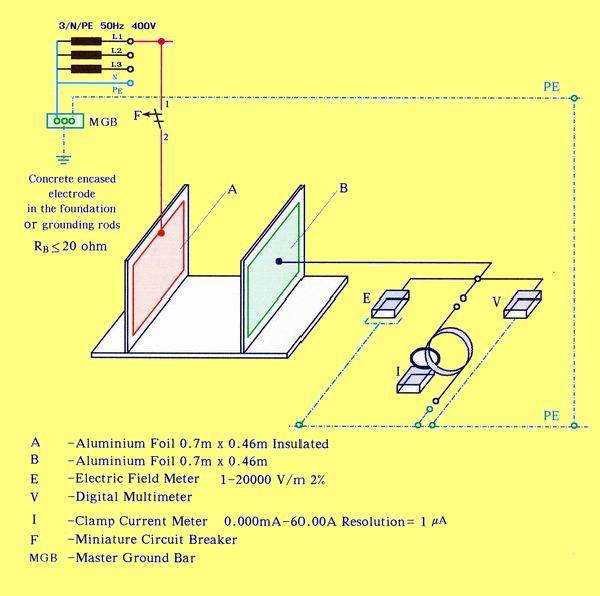
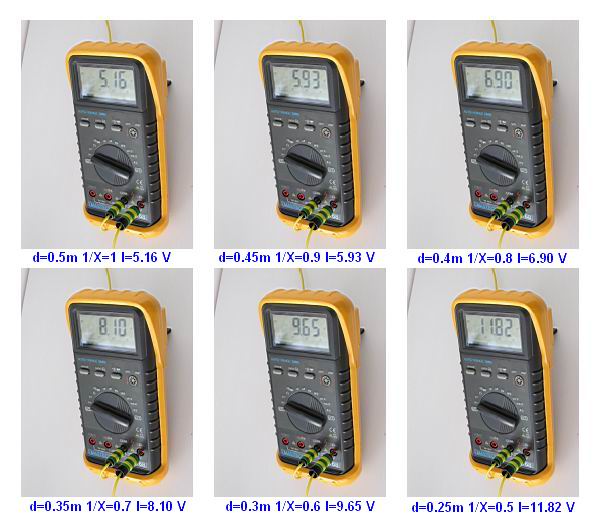
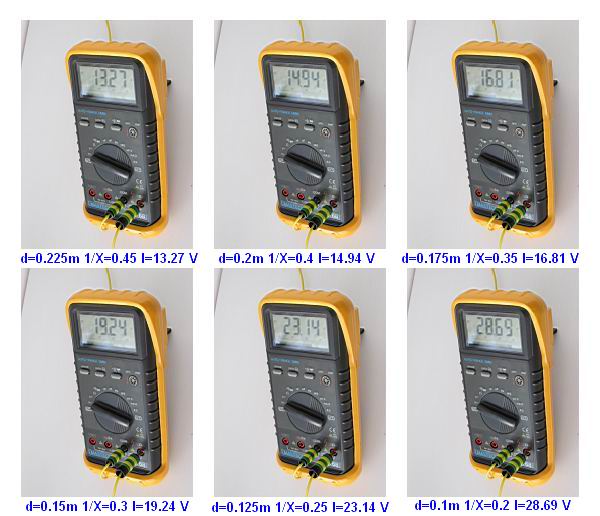
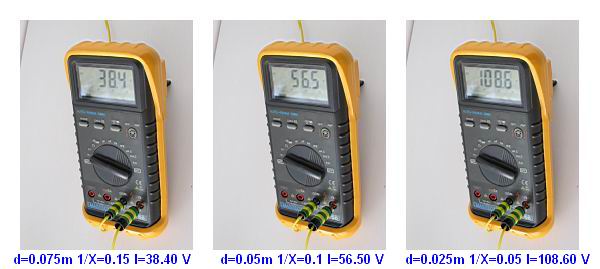
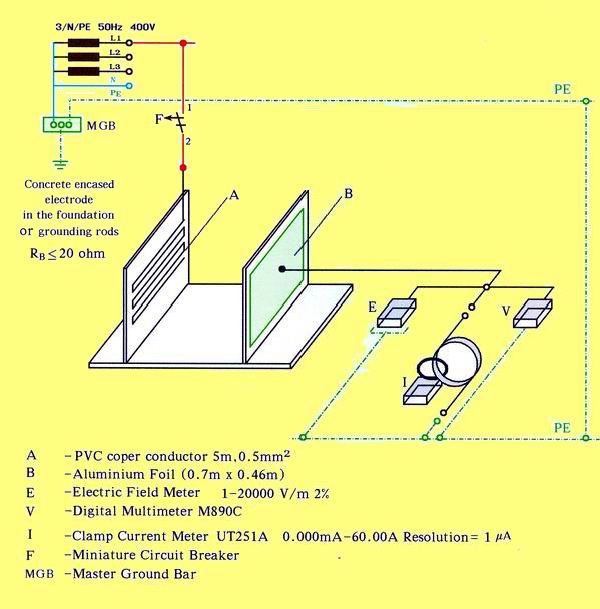
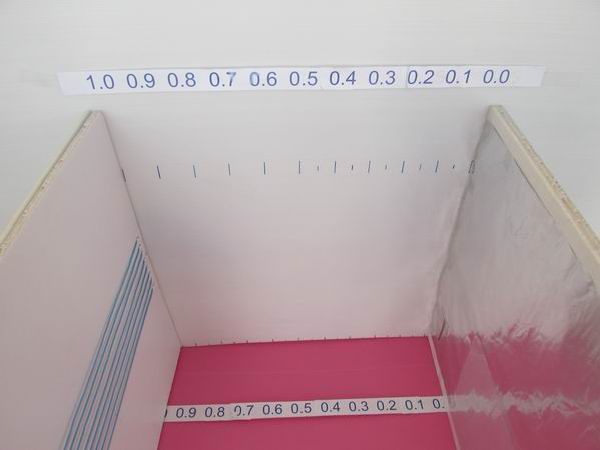
Stand1 Figs. 20 to 21 show the schematic diagram when the source of leakage current is an insulated aluminium foil connected to the local utility 230V 50 Hz Figs 20 to 24 show the measurements of electric field strength between two aluminium foils when the distance varies between 0.5m and 0.025m. Figs 25 to 27 show the measurements of leakage current between two aluminium foils when the distance varies between 0.5m and 0.025m. Figs 28 to 30 show the measurements of leakage voltage between two aluminium foils when the distance varies between 0.5m and 0.025m.
Fig. 20. Stand 1. Two aluminium foils.- Schematic diagram
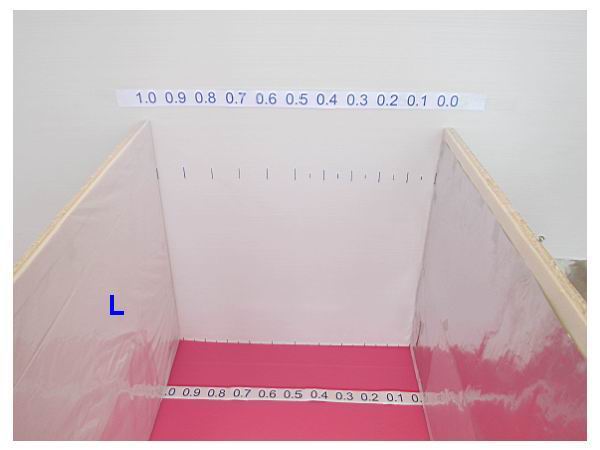
Fig. 21. Stand 1. Two aluminium foils
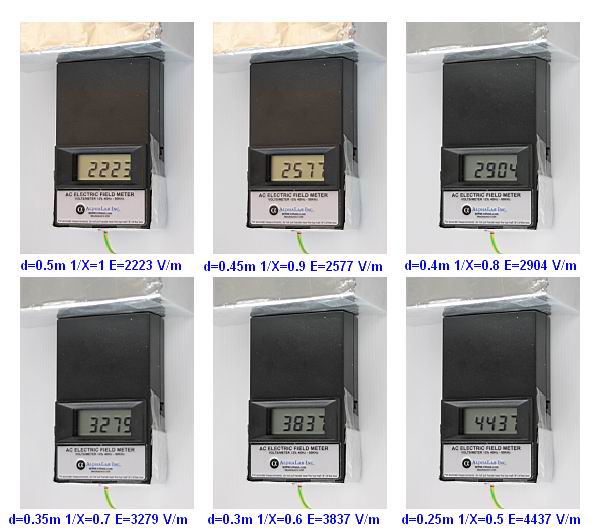
Fig. 22. Electric field strength measurements d=0.5 to 0.25m; X=1 to 0.5
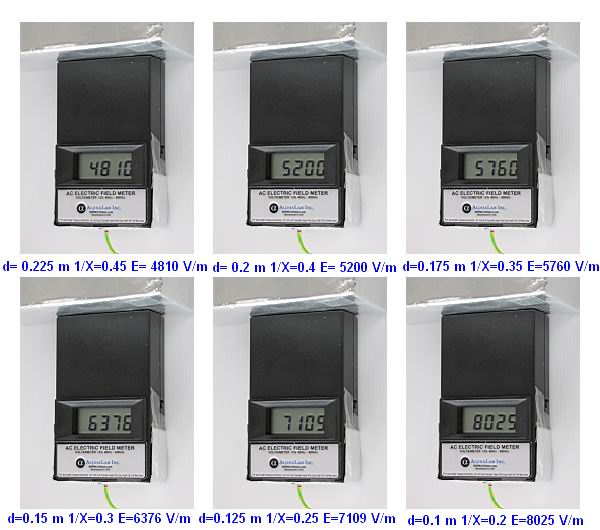
Fig. 22. Electric field strength measurements d=0.225 to 0.1m X=0.45 to 0.2
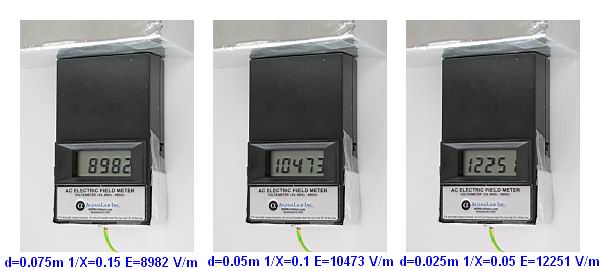
Fig. 22. Electric field strength measurements d=0.075 to 0.025m X=0.15 to 0.05
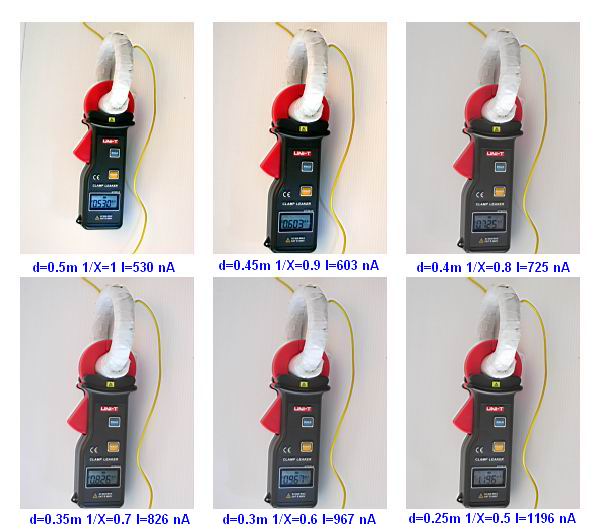
Fig.25. Leakage current measurements d=0.5 to 0.25m X=1 to 0.5
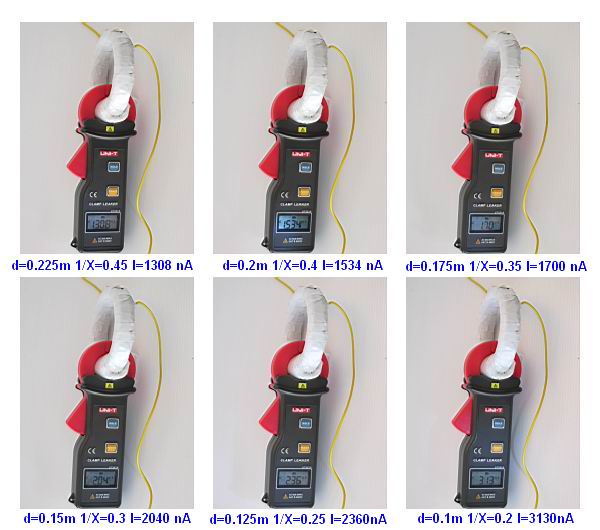
Fig. 26. Leakage current measurements d=0.225 to 0.1m X=0.45 to 0.2
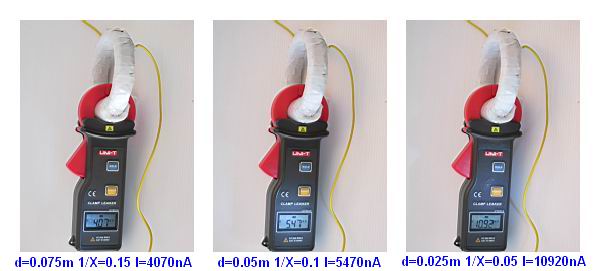
Fig. 27. Leakage current measurements d=0.075 to 0.025m X=0.15 to 0.05
Fig. 28. Leakage voltage measurements d=0.5 to 0.25m X=1 to 0.5
Fig. 29. Leakage voltage measurements d=0.225 to 0.1m X=0.45 to 0.2
Fig. 30. Leakage voltage measurements d=0.075 to 0.025m X=0.15 to 0.05
The electric field strength, leakage current and leakage voltage measurements that appear in Figs. 22 to 30 are shown in Table V.
d
X=d/0.5
1/X
Electric Field
Leakage Current
Leakage Voltage
m
V/m
Nano (10-9)Amps
Volt
0.5
1
1
2223
530
5.16
0.45
0.9
1.11
2577
603
5.93
0.4
0.8
1.25
2904
725
6.90
0.35
0.7
1.428
3279
826
8.10
0.3
0.6
1.66
3837
967
9.65
0/25
0.5
2.00
4437
1196
11.82
0.225
0.45
2.22
4810
1308
13.27
0.2
0.4
2.25
5200
1534
14.94
0.175
0.35
2.85
5760
1700
16.81
0.15
0.3
3.33
6376
2040
19.24
0.125
0.25
4.00
7109
2360
23.14
0.1
0.2
5/00
8025
3130
28.69
0.075
0.15
6.66
8982
4070
38.40
0.05
0.1
10.00
10473
5470
56.50
0.025
0.05
20.00
12251
10920
108.60
Table V. Stand 1 Electric field strength, leakage current and leakage voltage measurements d= 0.5 to 0,025m X=1 to 0,05
Stand 2 Figs. 31 to 32 show the schematic diagram when the source of leakage current is a PVC copper conductor 5m, 0.5mm2 connected to the local utility 230V 50 Hz only by the phase L (hot in USA). The second pole of conductor is insulated. The measurements are similar to the Stand 1 and summarizes in table VI.
Fig. 31. Stand 2. PVC copper conductor 5m, 0.5mm2Schematic diagram
Fig. 32. Stand 2. PVC copper conductor 5m, 0.5mm2
d
X=d/0.5
1/X
Electric Field
Leakage Current
Leakage Voltage
m
V/m
Nano (10-9)Amps
Volt
0.5
1
1
1502
386
3.96
0.45
0.9
1.11
1683
442
4.49
0.4
0.8
1.25
1920
501
5.13
0.35
0.7
1.428
2154
583
5.85
0.3
0.6
1.66
2480
664
6.73
0/25
0.5
2.00
2846
800
8.06
0.225
0.45
2.22
3075
866
8.65
0.2
0.4
2.25
3310
958
9.57
0.175
0.35
2.85
3643
1074
10.68
0.15
0.3
3.33
3990
1232
12.14
0.125
0.25
4.00
4380
1416
13.86
0.1
0.2
5/00
4884
1640
16.06
0.075
0.15
6.66
5546
2030
19.66
0.05
0.1
10.00
6422
2740
26.09
0.025
0.05
20.00
8290
4380
40.10
Table VI. Stand 2 Electric field strength, leakage current and leakage voltage measurements d= 0.5 to 0,025m X=1 to 0,05
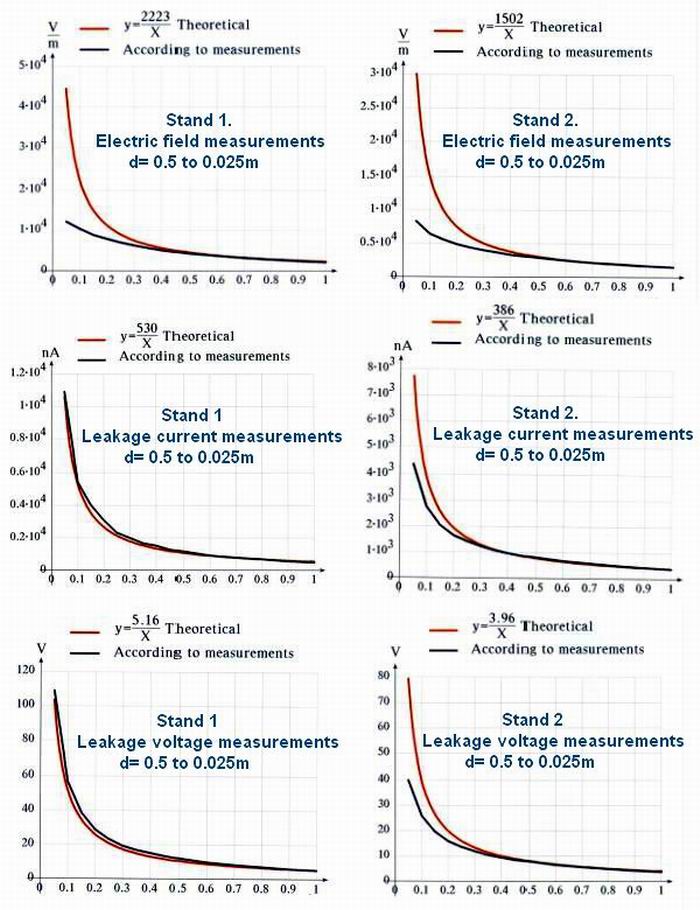
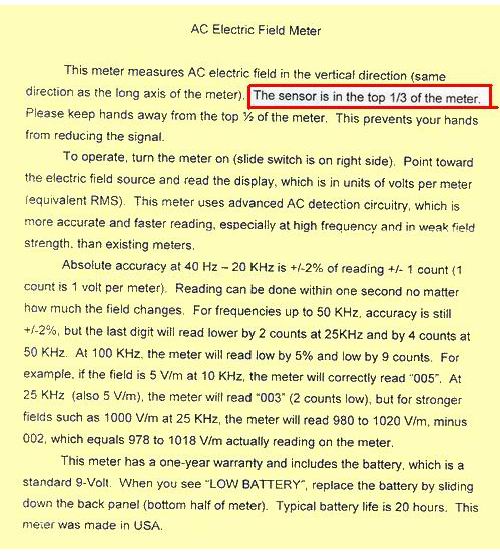
Comparisons between predicted theoretical and measured values of electric field, leakage current and leakage voltage that appear in Table V and Table VI are display in Fig. 33 as graphs. If the graphs of leakage current and leakage voltage indicates a similar characteristic between the predicted theoretical value and the measured value, the graphs of electric field dramatically illustrate a big difference between the theoretical value and the measured value for d= 0.4 to 0.025m The discrepancy between predicted theoretical and tasted values can be explained by the fact that the sensor of AC electric field meter "is in the top of 1/3 of meter".(See Fig. 34) It is very significant to note that graphs leakage current and leakage voltage from stand 1 indicate almost perfect coincidence between the predicted theoretical value and the measured value.
Fig. 33. Stand 1. Stand 2. Graphs
Fig. 34. AC electric field meter. Technical data.
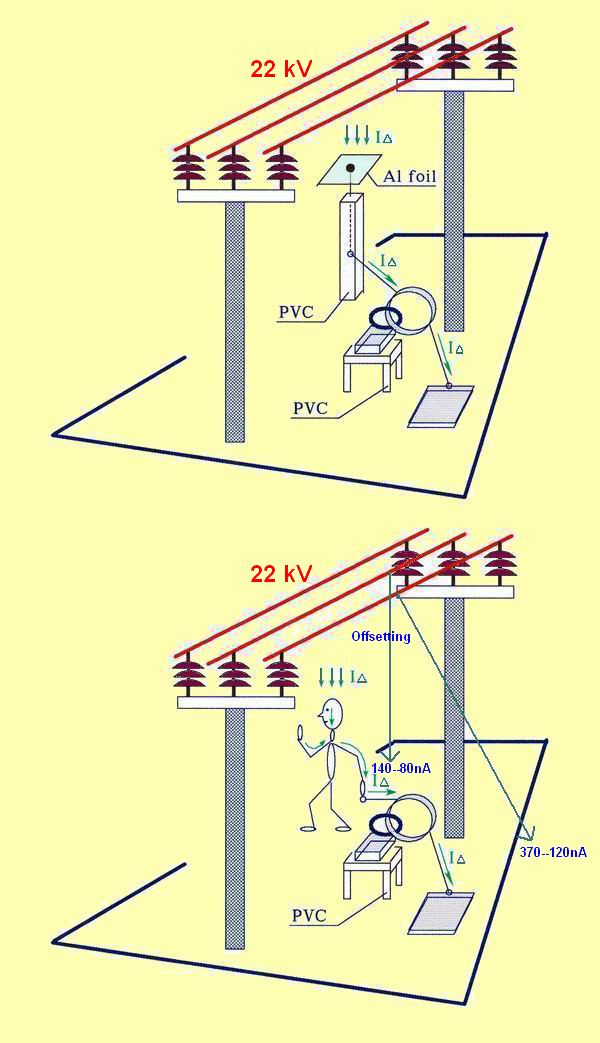
Leakage current outside Figs 35 show the measurements of leakage currents on the street under overhead power distribution line 22kV. The measurements highlight the offsetting phenomenon of leakage currents.
Fig. 35. Overhead power distribution line 22kV. Leakage current measurements
Conclusions The following conclusions arise from the above experiments:
Only measurements of leakage currents or leakage voltage can give usatrueand accurateapproximationof thecurrentspassing through thebodyineverycorner of the house.
The spreading law of leakage currents in our house is 1/X.
In house space our body, that contains 70% water, acts like a small black hole and absorbs leakage currents and becomes by itself source of leakage currents.
What is the permitted level of leakage current in the house? Still do not exist recommendations. In my house I have managed to decrease the leakage current as follows: at the computer and work table between 20 to 25 nanoamps in my sleeping area 8 to 10 nanoamps.
Recommendations Is it worthwhile to measure leakage current or leakage voltage of our body (3D sensor) in relation to ground? Definitely. Yes. To measure at home (sleeping area, computer, work table), at school, in hi-tech companies and in all institutions where people use electrical appliances connected to local source via two wire cord (L;N ). Maybe it's time to legislate the use of shielded conductors in kindergartens, schools, sleeping rooms. Remember, the human body has the ability to repair itself while it sleeps, but high level leakage current because external sources, (live electrical wiring in ceilings, walls and floors , electrical appliances on the bedside chest ) is thousands of times stronger than the body’s own electrical system. Long-term exposure to these high level leakage current can impair the body’s ability to communicate within itself and impact health.